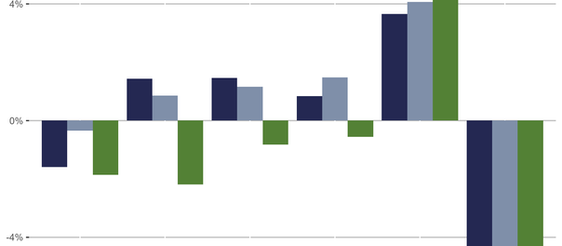

Weekly Factor Returns
Medium-term momentum (MTM) reversed sharply last week. Stocks that had outperformed the most over the previous six months underperformed last week. MTM fell the most in the small cap universe (-2.78%). The small cap MTM spread was one standard deviation below its average.

Brian
Dec 15, 2025


Weekly Factor Returns
Value was negative as investors were less sensitive to prices relative to financial metrics. Stocks with the most attractive valuations underperformed those with the least attractive valuations by 5.52% in the Russell 2000, on average. The negative return to Value among small caps was the largest in terms of its exceeding normal expectations. The small cap Value return was 2.75 standard deviations below its weekly average.

Brian
Dec 8, 2025


Weekly Factor Returns
Higher Volatility was the main driver last week. Stocks exhibiting the most Volatility outperformed those with the least Volatility across the capitalization spectrum. The small cap Volatility spread was +7.28% which was greater than two standard deviations above average. The large and mid cap spread were both greater than +6.5% and were also two standard deviations above their averages.

Brian
Dec 1, 2025


Weekly Factor Returns
Volatility was lower last week as investors sought stocks with lower price Volatility during the market’s decline. Stocks exhibiting the highest Volatility underperformed those with the least Volatility by 2.2% in the large and small indices. Volatility was -2.3% in the mid cap universe.

Brian
Nov 24, 2025


Weekly Factor Returns
Value was a positive influence, particularly among small caps. The most attractively valued securities outperformed the least attractively valued by 4.13% in the Russell 2000. The small cap Value spread was greater than one standard deviation above average. Value was positive in the large capitalized indices, but to a lesser degree.

Brian
Nov 17, 2025


High Volatility Continues to Rule the Day (and Market)
Factor returns were mostly subdued in the third quarter, except for Volatility, which continues to dominate other factor’s returns.
Higher Volatility stocks rose by 6.5% more than low Volatility stocks, an average. The Volatility spread contracted from last quarter but remained the top performing factor in the quarter and year-to-date. Volatility is up 8.7% in 2025.

Brian
Nov 13, 2025


Weekly Factor Returns
Value was a clear performance driver across all stocks. The most attractively valued securities outperformed the least attractive by 3.65% and 4.07% in the large and mid cap universes, respectively. The large cap spread was greater than one standard deviation above average, while the mid cap spread was two standard deviations above average. In the small cap universe, the Value spread was +7.36%. This equated to a three standard deviation move.

Brian
Nov 10, 2025


Weekly Factor Returns
Medium-term momentum (MTM) was a strong driver of returns, particularly in the large and mid cap universes. Stocks that outperformed the most over the previous six months continued to outperform last week. The large cap MTM spread was +4.46% and the mid cap MTM spread was +4.02%. Both were greater than one standard deviation above their respective average.

Brian
Nov 3, 2025


Weekly Factor Returns
Medium-term momentum (MTM) was strong in the large and mid cap indices. The MTM spread in the Russell MidCap was over 4.0%, while the large cap MTM spread was 3.23%. Both returns were greater than one standard deviation above their average. MTM in the small cap space experienced a small negative return.

Brian
Oct 27, 2025


Weekly Factor Returns
Medium-term momentum (MTM) was the lone factor with similar returns across all three indices in both direction and magnitude. Stocks that had outperformed the most over the past six months continued to outperform last week. MTM spreads were linear across the capitalization spectrum.

Brian
Oct 20, 2025
.png)
