.png)
2025 Q2 Small Cap Factor Review
- Brian

- Sep 11, 2025
- 3 min read
Volatility rebounds in historic fashion
All data in this post relates to the Jackson Creek small cap universe of stocks.
Four of our five key factors reversed course from the first quarter. Short-term momentum (STM) was the lone factor with directionally similar returns in Q1 and Q2; all other factors went from positive to negative or negative to positive. Volatility had the most extreme change of course.
Higher Volatility was a major theme in the second quarter. The small cap Volatility spread was 25.3% in Q2. This was by far the largest spread among the five key factors. The average return of the most volatile ten percent of stocks was 25.3% greater than the average return of the ten percent of stocks with the least Volatility. Volatility is now positive for the year. (More on Volatility below).
Value produced the second-largest spread with a -13.8% return. The least attractively valued stocks were favored relative to the most attractively valued. Value is now down 7.4% in the first half of the year
Short-term momentum declined for the second straight quarter, albeit to a lesser degree than its first quarter decline. Medium-term momentum (MTM) was mildly positive. The stocks that outperformed the most over the previous six months continued to outperform in the second quarter. STM is the worst performing factor in the first six months of 2025.
Smaller companies tended to perform better relative to the largest capitalized stocks. The largest ten percent of stocks in the Russell 2000 underperformed the smallest ten percent by 4.76%, on average. Size is the leading factor in the small cap universe.
Overall, the factors point to a riskier climate in the second quarter as high Volatility, poor Value, and smaller companies generally outperformed relative to those stocks with the opposite characteristics.
Factor Returns by Quarter & YTD


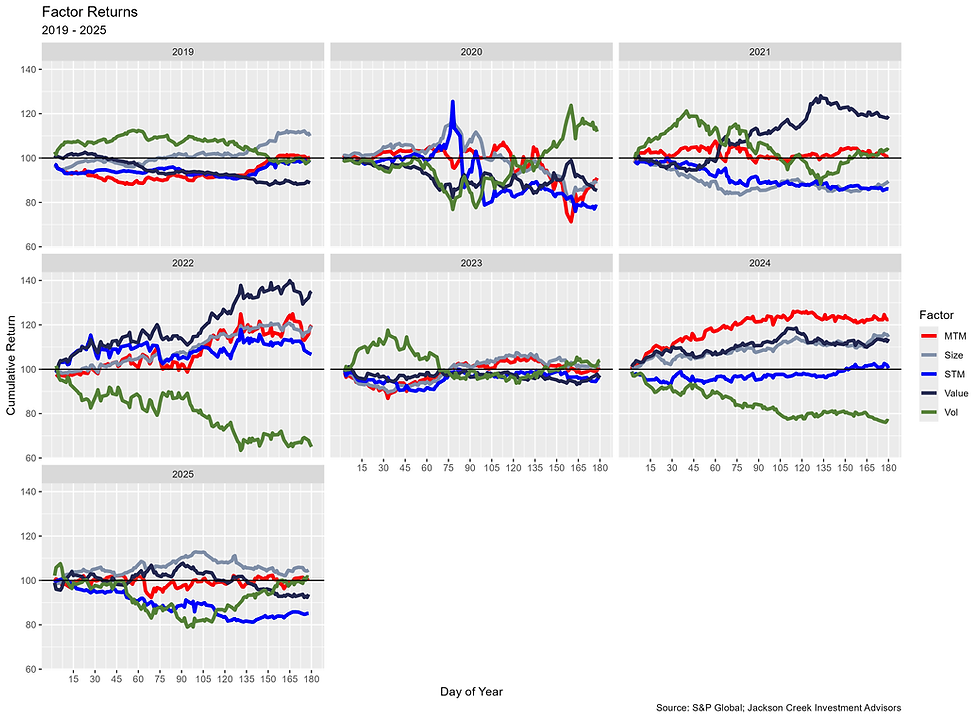
The following chart plots the daily cumulative returns for each factor during the first two quarters from 2019 through 2025. What stands out in the chart below (and above) is the reversals in Value and Volatility. Value was positive in Q1 and turned negative in Q2. Volatility was negative in Q1 and turned positive in Q2. In fact, the Volatility reversal was quite extreme.
In our first quarter recap (read: 2025 Q1 Small Cap Factor Review) we noted that Volatility had the worst Q1 performance in our 26 year data history. Volatility’s positive Q2 return ranks as the third-highest positive Q2 return and the fourth-largest positive return among all quarters since 2000. The past years with a stronger Q2 than the current year turned out to be the best two years for Volatility (2003 & 2020).
The Q1-to-Q2 Volatility return change was one of the more significant turnarounds in the past 25 years. The difference in the two quarters’ returns (not the cumulative return) was 43.7 percentage points. That makes it the third-largest positive turn since 2000. The most positive q/q reversal occurred in Q4 2001. The next highest q/q positive turn was Q2 2020. Interestingly, those previous two changes took place amidst a recessionary backdrop and major exogenous events.
Quarterly & FY Volatility Returns

Just to add a little more visual perspective, the histogram below charts the distribution of quarterly returns since 2000. The various shades of blue represent +/- one, two, or three standard deviations from the mean. The red dot on the x-axis represents the second quarter of 2025. The dot sits at 2.4 standard deviations from the quarterly average. There are only three other quarters with a larger return than Q2 2025. Also of note, the dotted line indicates the average quarterly return is negative.

The last chart below plots the current year-to-date path compared to previous years. Although the current year-to-date Volatility return of 2.27% (red line) does not look meaningful, the previous graphics show there is more to the story. If the recent trend continues, we could see another strong year for Volatility.
Annual Volatility Line Chart


Comments