.png)
Weekly Factor Returns
- Brian

- Nov 21, 2022
- 1 min read
A look at what factors influenced the market last week
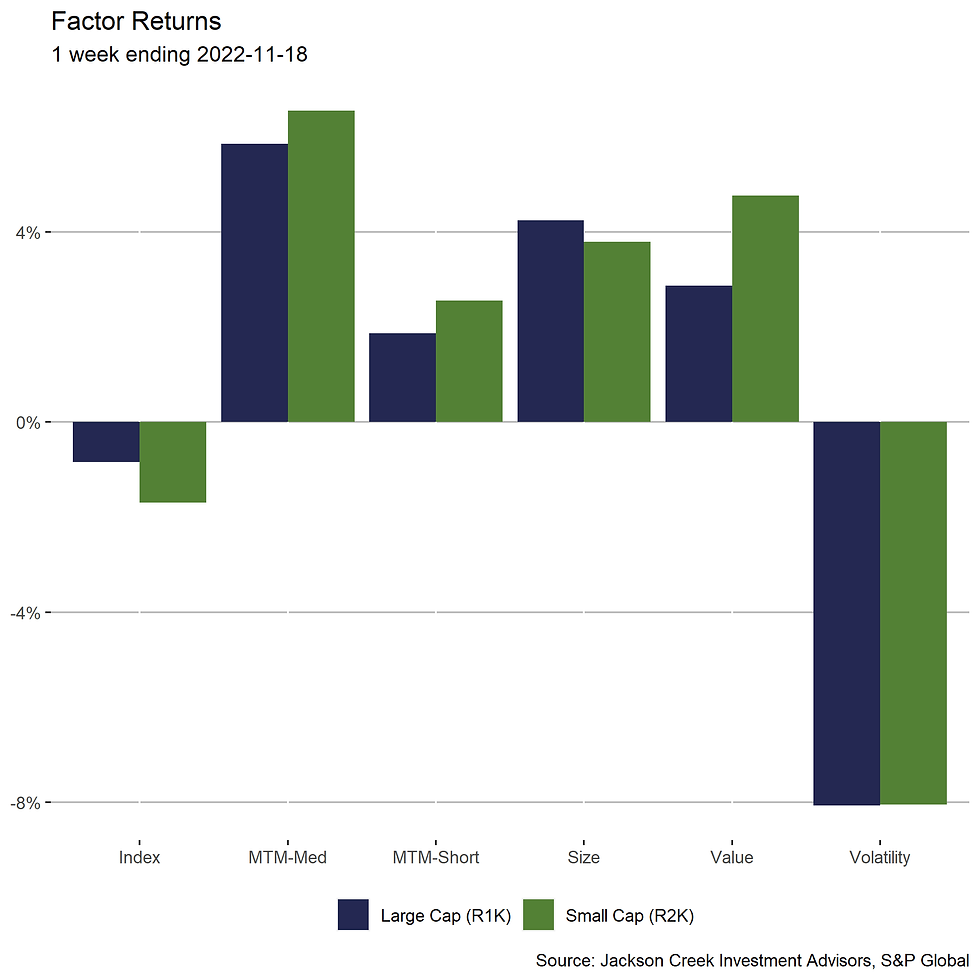
The Russell 1000 and Russell 2000 were negative last week after the strong rally the week prior. The large cap index declined 0.84% while the small cap index declined 1.7%. Factor returns were directionally similar. Three factors had returns greater than two standard deviations.
Volatility was the largest mover last week. Returns in both indices hit -8.00%. That means stocks with the least Volatility outperformed those with the highest Volatility. Both returns were 2.5 standard deviations below their averages.
Medium-term momentum (MTM) had strong positive returns. The spread between stocks in the highest decile and lowest decile of MTM was 5.85% in the large cap universe and 6.55% in the small cap universe.
Stocks that outperformed last week also tended to rank higher on Short-term momentum (STM), Capitalization (Size), and Value.
In this series, we highlight several factors’ returns along with the broad index. These are factors – or stock characteristics – we monitor closely. Factor returns equal the difference in the average return of the highest ranked 10% (decile 1) of stocks minus the lowest ranked 10% (decile 10) within each metric. Returns are based on stocks that pass our screen for liquidity, price, and analyst coverage; therefore, some index constitutes are excluded (except for index return). Ranks are sector neutral and equal weight. Stocks are ranked one week before the return period date, with returns calculated for the following week.
Read factor explanations here.


Comments