.png)
High Volatility Continues to Rule the Day (and Market)
- Brian

- Nov 13, 2025
- 3 min read
2025 Q3 Small Cap Factor Review
All data in this post relates to the Jackson Creek small cap universe of stocks.
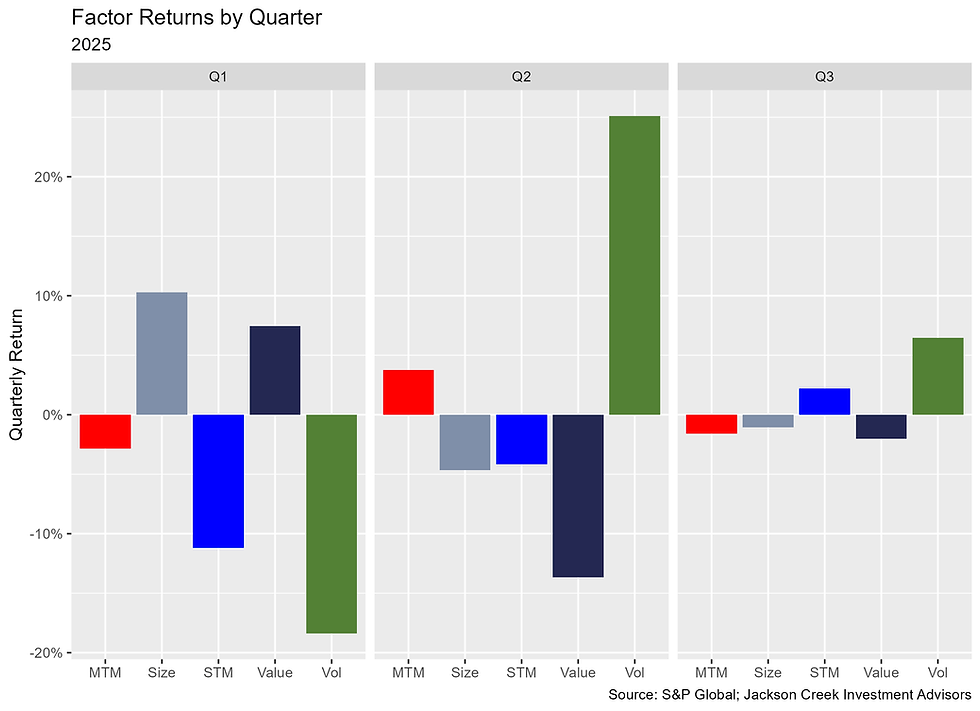
Factor returns were mostly subdued in the third quarter, except for Volatility, which continues to dominate other factor’s returns.
Higher Volatility stocks rose by 6.5% more than low Volatility stocks, an average. The Volatility spread contracted from last quarter but remained the top performing factor in the quarter and year-to-date. Volatility is up 8.7% in 2025.
The only other factor with a positive return was Short-term momentum (STM). Stocks with the highest STM outperformed those with the least STM by 2.2%, on average, in the third quarter. The +2.2% STM return was the second-largest spread. This was the first quarter of the year where STM had a positive spread. For the year, STM is down 13% - most among our five key factors.
Value stocks struggled again during the third quarter as investors were less discerning about price relative to financial metrics. The most attractively valued stocks underperformed the least attractively valued by 2.0%, on average. Value is down 9.1% on the year.
Capitalization did not play a major role in overall market returns. The small cap Size spread was -1.1 in the third quarter. This was the second straight decline for Size. However, after a strong first quarter, the factor is up 4.0% as of the end of September.
Medium-term momentum (MTM) was slightly negative (-1.6%) in the third quarter and has a -0.8% spread through the first nine months of the year.
The lack of either STM or MTM during the quarter coupled with higher Volatility and lower Value, points to a changing environment where investors were willing to take on more risk.
Factor Returns by Quarter & YTD

The following chart plots the daily cumulative returns for each factor during the first three quarters from 2019 through 2025. The factors appear to be somewhat rangebound, but that is due to the larger scale to make comparisons with prior years. What is noticeable, is the strong move in Volatility from the end of Q1 (around day 90) until the end of the third quarter. As we noted in our first quarter review (read: 2025 Q1 Small Cap Factor Review), Volatility experienced the steepest first quarter decline. It has subsequently rebounded over the past two quarters.

The final plots provide some insight into how Volatility is performing this year compared to the past two-and-a-half decades. This is not meant to be a technical exercise, but drawing a couple lines in the chart below frames the comparison to previous years where Volatility was very positive. Those years – 2020 (magenta), 2003 (yellow), and 2009 (light green) – were each periods of larger market upheaval. This year, Volatility is trending very positively without any prolonged market or economic crisis. Save for the brief time around “Liberation Day” (which took only about a month to recover from), the Russell 2000 has had a pretty good run over the past two quarters.
Our Second Quarter Review (read: 2025 Q2 Small Cap Factor Review) ended with this line: “If the recent trend continues, we could see another strong year for Volatility.” Well, with another three months in the books, this year’s Volatility return is shaping up to mimic previous years where substantial economic and/or market disruptions were occurring or had occurred. Years where high Volatility did exceptionally well.
Annual Volatility Line Chart

Due to Volatility’s similar trend in those years and remembering how broader markets trended in those same years, we thought it was necessary to create a corresponding plot with the Russell 2000 returns. A simple correlation of monthly returns for each year indicates that this year is closely correlated with 2020 – a .60 coefficient, albeit only nine months of returns. Should the Russell 2000 continue its trajectory, we could see strong returns as those seen in 2003 (+47%), 2009 (+27%), or 2020 (+20%). Of course, this is not a prediction, and we would have to see a strong fourth quarter as the Russell 2000 is up 10% through September.
Volatility, despite its large move in the last two quarters, is still below a 10% return for the year. That by itself is not extraordinary. The very positive returns that followed a similar trajectory as other standout years is what caught our eye. If Volatility returns for the remainder of the year rival those aforementioned years, those positioned for high Volatility to outperform should fare well. Alternatively, if Volatility loses steam, other factors could dominate the market.


Comments