.png)
Weekly Factor Returns

A look at what factors influenced the market last week
Equity markets were positive last week. The Russell MidCap index led with a 1.50% gain. The small cap Russell 2000 gained 1.15% and the large cap Russell 1000 gained 0.45%.
Four of the five key factors were directionally similar across the capitalization ranges. All factor spreads were within expected ranges.
Volatility was the leading factor within each index. The most volatile stocks outperformed the least volatile by 2.92%, on average, in the Russell 1000 and by 2.88% in the Russell MidCap. The small cap Volatility spread was 1.63%.
Value, which is often inversely correlated with Volatility, was negative. The most attractively valued securities underperformed the least attractively valued in the large and mid cap universes where each spread was below -1.0%. Value was marginally negative in the small cap index.
Size contributed positively to returns. The largest ten percent of stocks in each index outperformed the smallest ten percent, on average. The Size factor’s influence was inversely proportionate to the indices’ size. Size was most prominent among small cap stocks and least influential in the large cap index.
Medium-term momentum (MTM) was positive. Stocks that outperformed the most over the prior six months continued to outperform last week. MTM was strongest in the Russell 1000 (+1.83%). The mid and small cap MTM spreads were just below 1.0%.
Short-term momentum (STM) was the lone factor with diverging returns. Stocks that outperformed the most over the prior four weeks tended to underperform last week in the large and mid cap indices. STM was positive in the Russell 2000.
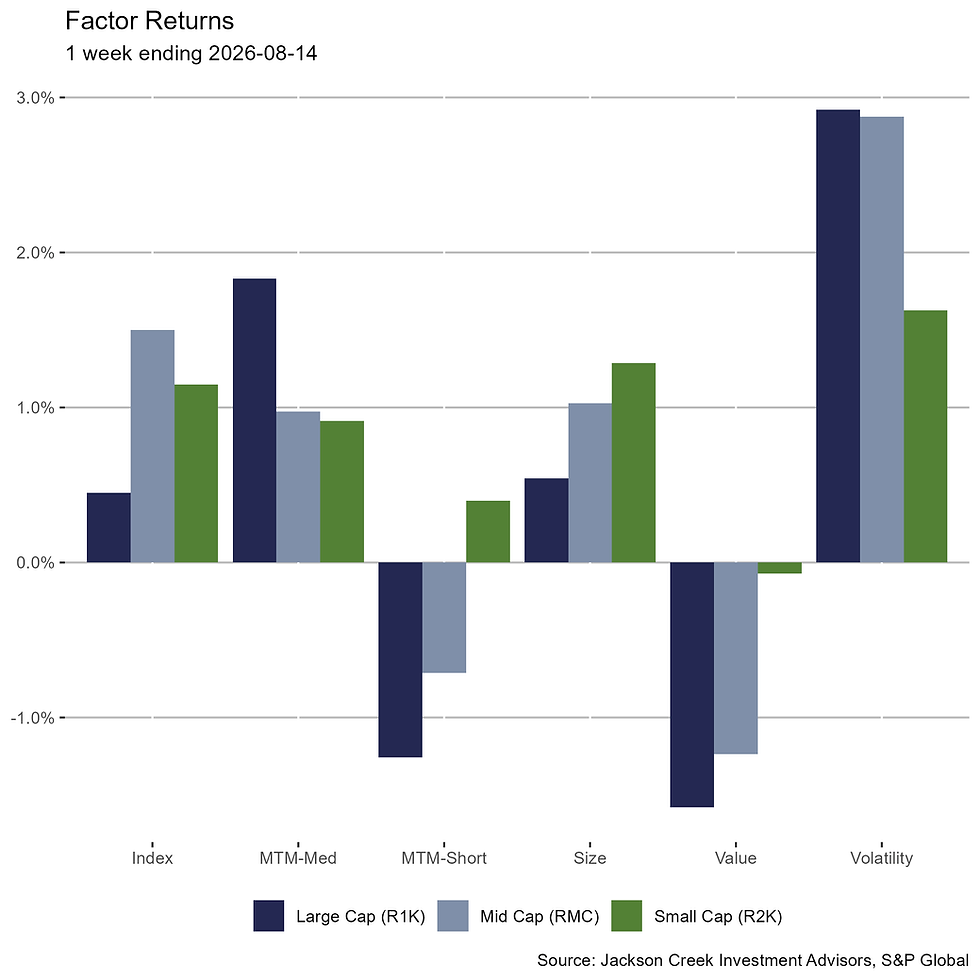
In this series, we highlight several factors’ returns along with the broad index. These are factors – or stock characteristics – we monitor closely. Factor returns equal the difference in the average return of the highest ranked 10% (decile 1) of stocks minus the lowest ranked 10% (decile 10) within each metric. Returns are based on stocks that pass our screen for liquidity, price, and analyst coverage; therefore, some index constitutes are excluded (except for index return). Ranks are sector neutral and equal weight. Stocks are ranked one week before the return period date, with returns calculated for the following week.
Read factor explanations here.
The Russell 1000 Index is a U.S. stock market index that tracks the highest-ranking 1,000 stocks in the Russell 3000 Index, which represent about 93% of the total market capitalization of that index.
The Russell Midcap Index is a stock market index that measures performance of the 800 smallest companies in the Russell 1000 Index.
The Russell 2500 Index measures the performance of the 2,500 smallest companies in the Russell 3000 Index, with a weighted average market capitalization of approximately $4.3 billion, median capitalization of $1.2 billion and market capitalization of the largest company of $18.7 billion.
The Russell 2000 Index is a small-cap U.S. stock market index that makes up the smallest 2,000 stocks in the Russell Index. It was started by the Frank Russell Company in 1984. The index is maintained by FTSE Russell, a subsidiary of the London Stock Exchange Group.
Index performance is presented as a benchmark for reference only and does not imply any portfolio will achieve similar returns, volatility or any characteristics similar to any actual portfolio. The composition of a benchmark index may not reflect the manner in which any is constructed in relation to expected or achieved returns, investment holdings, sectors, correlations, concentrations or tracking error targets, all of which are subject to change over time. You cannot invest directly in an index. Index performance does not reflect the deduction of any investment management fees, transaction costs, or expenses, and the performance of any investment product may differ from the index.


Comments