.png)
Quarterly Market Data - March 2026
- Brian

- Apr 24
- 2 min read
Commodities surged, domestic large cap equity lagged
Asset Class Returns
Major Asset Class Returns for the 3 Months Ending March 31, 2026

Commodities soared in the first quarter, driven largely by oil. The price of oil increased over 70% due to the war in Iran and subsequent closing of the Strait of Hormuz.
Real Estate had the second-highest return among the major asset classes.
Non-U.S. markets fared best among major equity categories. Emerging Markets (+3.80%) and International Developed (+1.15%) beat out each capitalization range of U.S. equities.
Large Cap U.S. stocks had the worst performance during the first quarter. The group was weighed down by the unwinding of the AI trade, which tended to disproportionately punish larger technology companies.
Fixed Income posted a small loss. Rising interest rates (see more below) tipped the scales against price appreciation.
The table below depicts the same information as above and shows which representative security is used for each asset class.

Source: Jackson Creek Investment Advisors; S&P Global
Major Asset Class Returns for the Twelve Months Ending March 31, 2026

All eight asset classes have a positive twelve-month return. The asset classes have appreciated in the year since the market bottomed last April.
Due to the surge in the first quarter, Commodities have the highest twelve-month return (+41.6%). Commodities were lagging behind most other asset classes at the beginning of the quarter.
All other asset classes declined during March. Emerging Markets have the second-highest twelve-month return (+31.2%).
Small Cap U.S. Equities outpaced large and mid cap domestic stocks over the past year.
Fixed Income gained 1.67% over the past year.
1 Month U.S. Index Returns with Growth & Value Styles
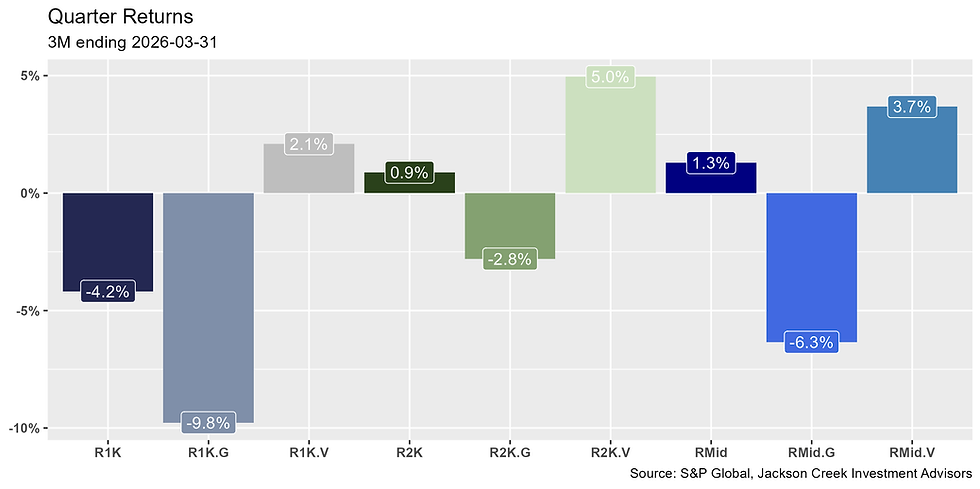
Value outperformed Growth within each capitalization range. Re-rating across the AI ecosystem benefitted companies trading at more reasonable valuations.
The Value/Growth gap was most pronounced in the large cap universe.
Small Cap Value bet all other styles. Small Cap Growth declined the least relative to large and mid cap peers.
Interest Rates
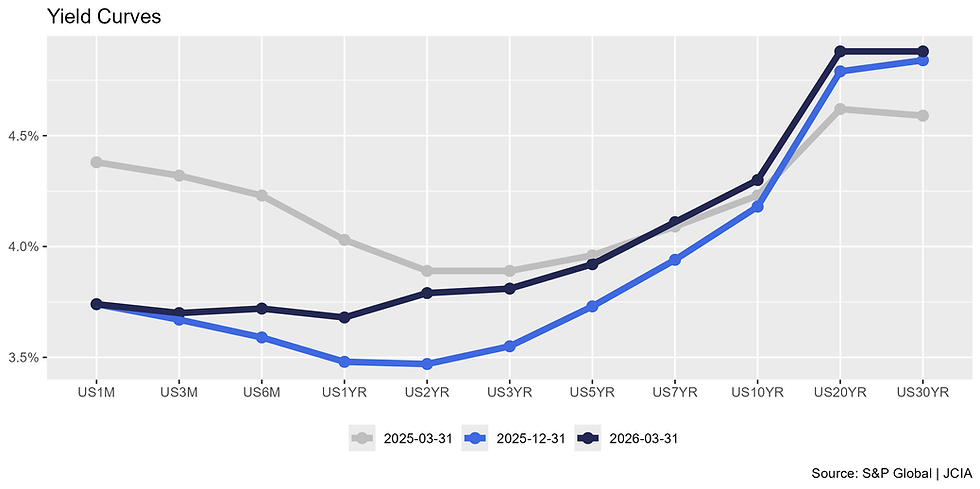
Compared to the end of December, the yield curve shifted upward along each maturity except for the shortest 1M duration, where it was unchanged.
The yield curve straightened as mid-term rates rose more than the short and long ends.
The 10YR yield ended at 4.3%.

The 2Y/10Y spread narrowed from the end of the year due to the 2YR yield rising more than the 10YR. The 2YR yield increased from 3.47% in December to 3.79% in March.
The 2/10 spread has been positive for the last twelve months.
Disclaimer - this is not to be construed as investment advice or a recommendation to buy or sell any security. This is not meant to be indicative of any specific portfolio returns. Please see full disclosure on main blog page.


Comments